
One of the most efficient and easiest ways to transform data into an asset is to make it available to your business in an easy-to-use form through your dashboard. Never lose sight of the power of simplicity — dashboards with the right amount of information, in the right hands, at the right time, can empower organizations in unimaginable ways. Used correctly, dashboards can help you make informed decisions by allowing you to see what you are doing right, where you need to improve, and what the trends are.
In the article, we are going to discuss dashboard web apps, their benefits for business, key features, and the way of their development.
Table of Contents
- 1 What is a Dashboard?
- 2 Dashboard vs Report: What is the Difference?
- 3 What is Dashboard Software and How Does It Work?
- 4 The List of Most Popular Dashboard Software in 2022
- 5 Top-3 Reasons You Need a Product Dashboard Web App
- 6 The most common types of dashboards
- 7 The Key Features of a Dashboard Web Application to Must-Have in 2022
- 8 Pros and Cons of Custom-Built Dashboard Software
- 9 How to Create a Dashboard Web Application
- 10 How Much Does It Cost to Develop Your Dashboard Software?
- 11 Technology Stack
- 12 Conclusion
What is a Dashboard?
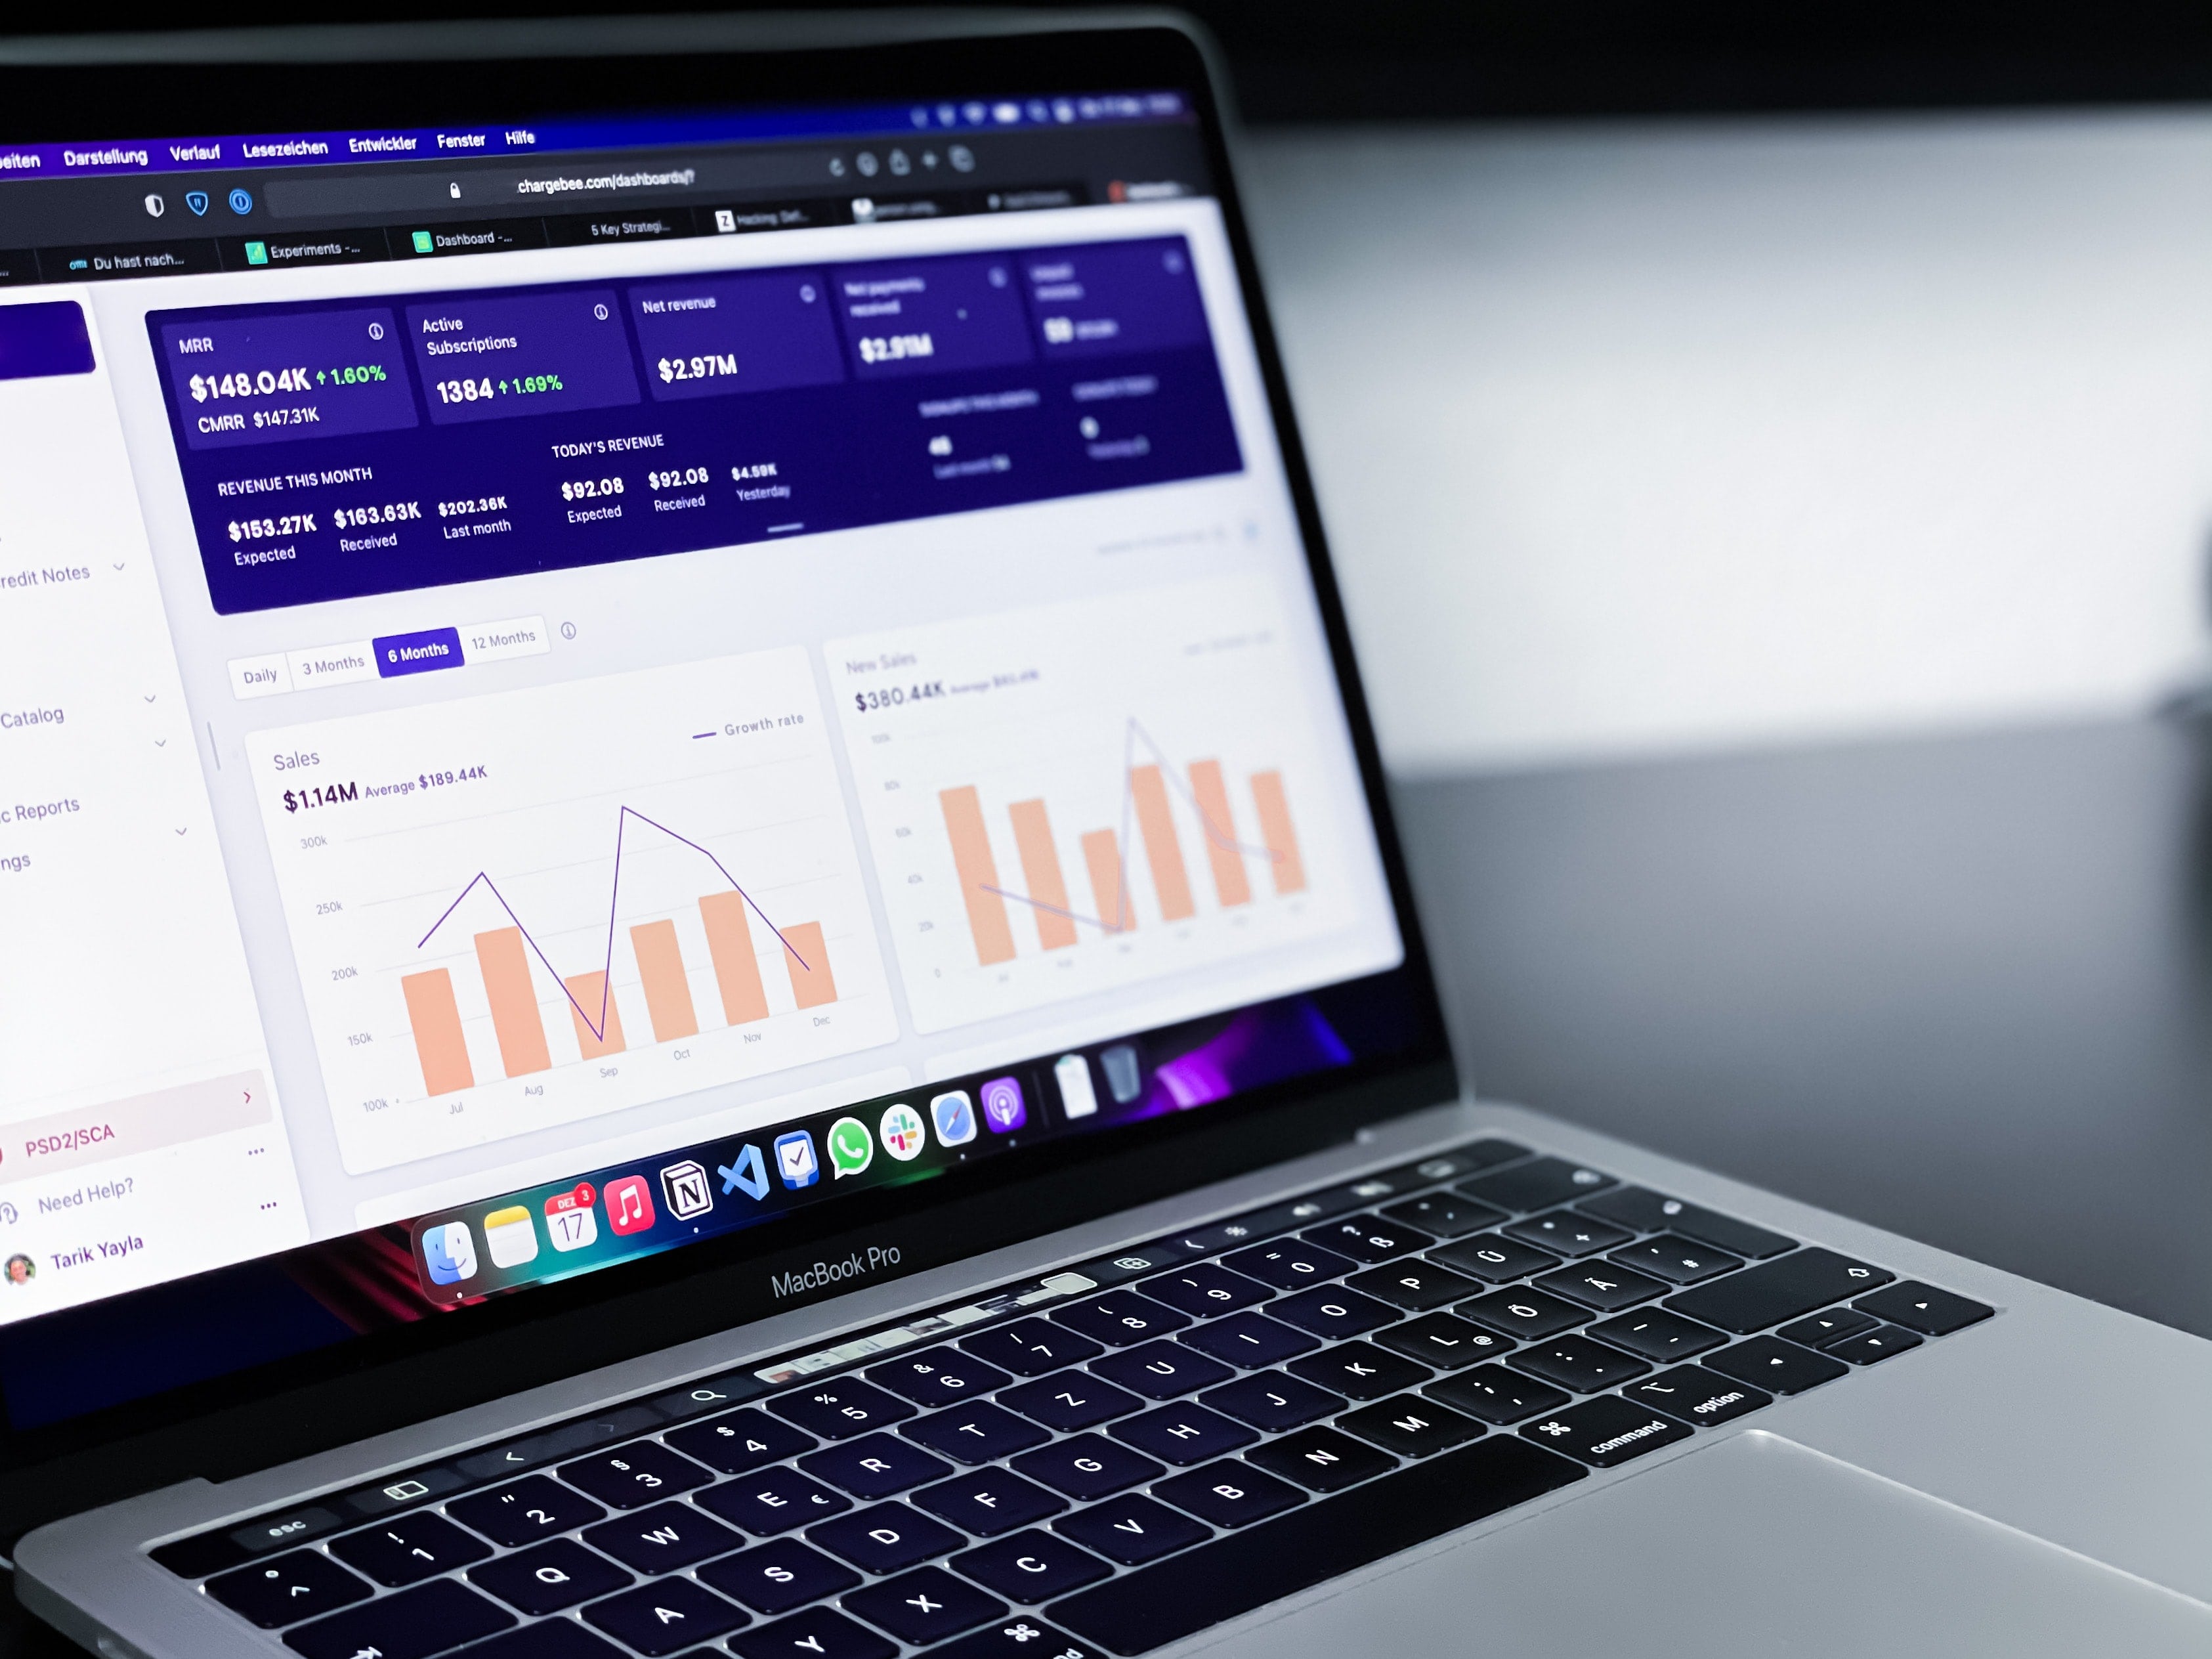
The dashboard is a graphic display of the information. It is used for various purposes, but the key one is to demonstrate such data as a KPI. The dashboard is usually on a separate page and retrieves information from a related database. Commonly, dashboards are customizable. Thus, you can choose what data you want to see and whether you want to include charts or graphs to present numbers.
What supports a dashboard and data visualization on it? Behind the scenes, the dashboard connects to the files (such as an Excel or Google spreadsheet), attachments, services (such as QuickBooks or HubSpot), and APIs. The control panel converts the raw data into something readable.
Dashboard vs Report: What is the Difference?
Dashboards differ from reports in their design, granularity, and variability.

Design
Dashboards are designed to be viewed entirely on a single screen, while reports can be any number of pages (or when viewed digitally screens). Of course, this rule has gray areas. Some reports can be very concise — one chart or one table on one page. Sometimes dashboards take up the full width of the screen, but this requires the viewer to scroll down to see all of the components.
Granularity
Dashboards contain a collection of charts and tables on several related topics, while reports contain charts and tables on a single topic. Thus, dashboards usually offer a general overview of the subject, and reports tend to be more detailed and narrow.
Volatility
Dashboards are designed to display actual data, so they are often viewed digitally and regularly updated with the latest information. In contrast, reports are usually used in a static format such as PDF and therefore usually run only once. Thus, dashboards are great for displaying highly volatile data, while reports are better suited for data that does not change as quickly.
What is Dashboard Software and How Does It Work?
Dashboard software is a tool that pictures data to help people understand the analytics and metrics of their company and projects. It tracks, collects, and presents data in a visual format. The software basically gives you insight into everything that has happened, is happening, and will happen in your business. Simply put, it converts huge amounts of data into a plain visual format, giving you all the data you need in one place.
Besides that dashboard application development allows any team member to instantly create charts and automatic reports and share them with decision-makers, it offers a range of advantages that will notably drive the growth of your business:
- It offers real-time updates on all your business processes.
- It’s available anytime from anywhere as long as you have an Internet connection.
- It helps in risk-minimizing and better decisions making.
- It’s taking data management to the next level with AI.
- It helps predict user behavior.
Simply put, the dashboard software provides a clear view of all data, keeps you informed, and organizes your work in ways that increase productivity, improve overall productivity, and simplify your day-to-day business activities.
The List of Most Popular Dashboard Software in 2022
Now, let’s take a look at some of the best dashboard software!
Klipfolio

Sisense
Sisense comes with built-in collaboration tools that allow you to collaborate, annotate, and share reports. It has a library of industry-specific KPIs to track different areas of your business. What’s more, Sisense is a drag-and-drop self-service platform and also supports end-to-end data encryption.
Grow

iDashboards
iDashboards is a self-service business intelligence software that helps you create custom and interactive dashboards with simple drag-and-drop functionality. This software contains over 225 charts and graph templates, as well as a built-in ETL tool that allows you to directly connect to CRM, databases, and web applications.
Zoho Reports
Zoho Reports is a business intelligence and analytics solution that is also a software dashboard. It allows you to create reports and dashboards and integrates with multiple databases, applications, and external files. A special feature of Zoho Reports is that it comes with a built-in artificial intelligence called Zia. All you have to do is ask questions in Zoho’s interface and Zia will generate the required charts. It also comes with drag-and-drop functionality and other customization tools for updates and app building.
Top-3 Reasons You Need a Product Dashboard Web App
The right dashboard can revolutionize your success and the pleasure of doing business. In particular, having the right toolbar will give you five main benefits:
☑️Save time
How much time do you or your employees spend creating reports in Excel or other spreadsheet programs? Any report that you create more than once should appear in your dashboard. And when you get to the dashboard, the report can be programmed to update hourly.
☑️Improved results
The point is, when you see your KPIs in the dashboard, you intuitively start to improve your results. To do this, the best dashboards automatically display success indicators, such as a green up arrow when you’re doing well, and a red down arrow when you’re not. When you see red arrows, you naturally want to fix those areas so they turn green. And you do it, and as a result, sales and profits will skyrocket.
☑️Better productivity
Dashboards allow you to measure performance numerically. For example, your account manager might see metrics such as return rate, average phone answering rate, etc. It’s important to note that when they see their performance in numbers, especially if you use green and red arrows.
The most common types of dashboards
There are three types of dashboards. But which one fits your company the best? Let’s take a closer look at all of them.

- Operational dashboard
An operational dashboard is concentrated on controlling performance and operations for your business with a shorter time horizon. These tools are convenient for viewing operational processes. As they help monitor and analyze a company’s performance in a certain business, region, and department.
- Strategic dashboard
A strategic dashboard is useful for a senior executive or business owner. They measure a company’s long-term strategy using key success factors. Usually, these dashboards are used by corporations to measure strategic goals.
- Analytical dashboard
An analytical dashboard uses companies’ past data to recognize tendencies that could lead them to make better decisions for their future. Users can easily create, interact and explore dashboards. The analytic dashboard provides detailed business insights that increase the confidence of leaders in making more complicated decisions about the business.
The Key Features of a Dashboard Web Application to Must-Have in 2022
To take your data and ideas to the next level and make, we are going to share with you a basic set of dashboard web application features.
✓KPI dashboard measure
This element is an important dashboard element that people should pay attention to. Dashboards are most valuable when they measure your KPIs. KPIs help you track the most valuable assets and expenses in the company. Also, they help in tracking your team’s progress towards a specific goal, be it sales, digital marketing, or manufacturing.
✓Diagrams
Dashboards visualize your data in many different ways. Bright charts and catchy tables help you display important metrics quickly and attractively. Data converted into a visual chart or graph is easier to understand. This allows the user to understand complicated dashboard data that can improve business performance. For example, you can use a bar chart to explain the specific numbers and numbers that affect your vanity metrics.
✓Real-time data processing
Data displayed in a well-designed dashboard must be processed in real-time to stay relevant. Fast data processing is a feature that ensures your data is timely and accurate. While it may never reflect specific changes for a few seconds after they have occurred, the dashboard software is constantly evolving to meet the demands of today’s business.
✓Global filters
Most often, dashboards present several graphs and charts on one page. This allows you to measure your most important KPIs from a central hub. Good business intelligence software integrates global dashboard filters into its designs. With just a few clicks, you can easily make changes that will affect the data displayed on your dashboard. Moreover, you can often save your customized filters so that you or another viewer can link to the saved metrics at any time.
✓Global style options
Global style options allow changing the way dashboard items look without having to create a completely new visualization. Not only can you swap a specific chart, but you can also change the font, color, background, and border of any visual element. This is an important feature because it allows you to customize and label data to suit your organization’s goals.
✓Built-in objects
The best dashboard designs allow you to embed objects directly into the KPI dashboard itself. This means that when you share reports with stakeholders, instead of seeing the logo of the dashboard itself, you can put your company logo on it.
✓Access 24/7
Your data and analytics can be available to you at any time of the day from any device. Businesses can access most of the cloud dashboard software from a computer, smartphone, or tablet. Some dashboards may not yet offer mobile support, but many are rolling out this feature if it becomes an industry standard.
✓Sharing options
Sharing data and reports from a dashboard helps create a data-driven environment in your organization. Good KPI dashboard software often includes many options for quickly communicating with your team. This can be done by logging into the dashboard from another device, sending visualizations and reports by email, or using an external viewer.
✓KPI dashboard tabs
Dashboard tabs are a useful feature when there is too much data on a single page. You can have separate dashboards related to traffic, marketing, social media, and more, with tabs. Instead of trying to figure out relationships from a single dashboard, you can flip through organized tabs to quickly find the data you want.
✓Dynamic images
The same meaning given to data visualization can be applied to other information as well. Some dashboards include live images, a feature that allows you to display images according to the information being presented.
✓Print borders
You may need to print the information on the dashboard for reference. In such cases, print boundaries help format the KPI dashboard for export. Print borders can then convert your dashboard to PDF or PNG files without breaking the rendering. drill down on key details. A fully implemented strategic dashboard can shorten the time it takes a business to achieve a specific KPI while reducing operating costs.
Pros and Cons of Custom-Built Dashboard Software
If you are looking to create a dashboard application, you should be familiar with the alternatives. In the case of a dashboard for your site, it’s possible to select from ready-made solutions. Apparently, with custom dashboards, you have a lot more control. You can customize them to any desired shape and color, extract from any data source, and protect data with progressive security techniques such as user role restrictions.
But this setup is expensive: it takes longer to build and deploy custom data cards; It also usually requires a higher upfront investment than off-the-shelf web panel solutions.
Here is the list of custom-build dashboard software benefits:
- can be 100% optimized for your business processes;
- security, appearance, support for mobile devices will depend on how much you want to invest;
- can be upgraded if needed.
Below, we’ve mentioned the most prominent drawbacks:
- requires considerable initial investment;
- takes longer to deliver;
- it is not always possible to reuse open-source components.
How to Create a Dashboard Web Application
Developing a web app for a dashboard may seem like a trivial task, but it is a tricky business if you want your workers to accept the app. Here are the stages to build a dashboard app.

You have to define the target audience’s needs to understand how a web-based dashboard application can help them run their business more effectively. The best way is to conduct user surveys and interviews. This information will define the functionality of the dashboard.
Stage #2. Design
As with any software project, you start developing a web dashboard by creating rough wireframes that are rather easy to modify based on user reviews. Wireframes are used to create an interactive prototype that is refined using tools.
Stage #3. Review available tools
Although, we advise taking the time to research the available toolkits that can lead the development of your web panel.
Stage #4. Testing
Once you’ve designed your dashboard, it’s time to test it out with real people. In addition to verifying that all features are working as expected, you should also run stress testing to determine how many users can handle the solution.
Stage #5. Deploy and maintain
The final step is to deploy the dashboard solution, remove all test data, and configure the backup mechanism to guarantee your product is always available for users.
How Much Does It Cost to Develop Your Dashboard Software?
The cost of developing an application will largely depend on the size of your project. It’s a personal website dashboard, it will take less time. However, if you want to create an enterprise-grade solution, you will need more developers and more time. Other factors to consider are the programming languages chosen, the complexity of the design, the number of integrations, etc.
How Long Does It Take to Build a Website? [Estimation Examples]
The exact information about the required time and team we can provide you after the discovery phase. Thus, the best option is to contact us for a full consultation and preliminary assessment via e-mail: [email protected] or through the contact form. Here is the list of the possible time frames in case you hire one full-stack developer.
- Front-end: 24-54 days (192-432 hours)
- Back-end: 37-87 days (296-696 hours)
- Total: 61-141 days (488-1128 hours)
In the case of Code&Care, we offer web application development services starting from $34.50 hourly and extended team & staff augmentation $4800 monthly.
Technology Stack
What is the key thing you need to take into account when it comes to creating a great dashboard solution? Entrepreneurs, especially without a technical background, find it tough to select programming languages. We provide you with a list of technologies that are best suited for dashboard apps:
- Front-end: HTML, CSS, and JavaScript
- Framework: React.js
- Back-end: Node.js
- Database: PostgreSQL
Conclusion
Now you have everything you require to build an attractive and profitable dashboard app. If you are still unsure about some aspects of this daunting task, such as choosing the best tech stack, your app monetization strategy, how long it will take to develop an app, or upgrading a current dashboard on your website, our team is here to help you. Get a free consultation and we’ll help you design, test, create and deploy a useful dashboard.
 Related articles:
Web Application Development Cost: The Full Guide On Your Project Price
How to manage a remote development team: Challenges, Tips, and Best Practices
How to Hire a React Developer in 2022 [The 5 steps guide]
How to choose technology for web development: 6 critical steps


No comments yet.
Give us your impression about this article.